


Origin Story: It Started With a Rejected Pull Request…
In December 2013, Torkel Ödegaard was facing a familiar problem: his team was using Graphite to monitor metrics, but almost nobody was actually looking at the dashboards. Why? Because the tools to visualize the data were clunky, unintuitive, and just not enjoyable to use.
At the same time, Torkel noticed something different with Kibana-the tool his team was using for log analysis. Kibana had a clean UI. It had easy to build dashboards. People actually wanted to use it.
That contrast sparked an idea: what if you could bring Kibana’s ease-of-use to Graphite’s metrics?
Torkel started experimenting over the holidays. He first tried adding Graphite support directly into Kibana-but Elasticsearch rejected the pull request. So, he built his own UI from scratch.
What followed was a 14-day GitHub commit streak that gave birth to Grafana-an open-source, feature-rich dashboarding tool built for time-series data.
When Torkel demoed it to his team, it became an instant hit. Not just with his colleagues, but across other teams too. Developers finally had a way to explore metrics without wrestling with the interface.
That’s when the bigger vision came into focus: make metrics accessible to everyone-not just the monitoring experts.
Grafana wasn’t just a better front-end for Graphite. It was a gateway to democratizing observability inside companies. And that philosophy would shape everything Grafana did going forward-from how they built the product, to how they engaged users and eventually, how they monetized.
Adoption First, Monetization Later: How Grafana Won Developers and Built a GTM Flywheel
Grafana didn’t grow because of a flashy launch or paid marketing blitz. It grew because it solved a real pain point-and developers felt it immediately.
From day one, Grafana was designed with developers in mind. It was easy to install, intuitive to use, and most importantly-it just worked with the tools people already had. Whether you were using Graphite, Prometheus, or InfluxDB, Grafana integrated seamlessly. No lock-in. No proprietary push.
This interoperability wasn’t just a product choice - it was a master stroke in building a community around Grafana.
By playing nicely with other tools, Grafana bridged smaller ecosystems together. It became the common visual layer for anyone working with time-series data. And in doing so, it tapped into not one community, but many.
As Torkel shipped new releases, the feedback loop was instant. Tweets, Community conversations, issues on GitHub, pull requests from contributors - his phone would light up every time something went live. Grafana wasn’t just being used - it was being adopted, improved, and shared
The velocity of feedback became a flywheel. Developers felt heard. Their contributions showed up in new releases. And slowly, Grafana became the default for visualizing metrics and building dashboards. Whether you were monitoring Kubernetes clusters or tracking solar output at home, Grafana was the de facto.
Grafana wasn’t built for an audience. It was built alongside one. Developer-first DNA would go on to define its entire GTM motion.
For the best part, it was still completely free.
Grafana made an intentional decision not to gate features or force conversions. There were no paywalls, no premium tiers, and no nagging upgrade prompts. The result: over 1 million active instances and nearly 10 million users-a huge top-of-funnel, powered entirely by community adoption.
A large chunk of those users were hobbyists-using Grafana to track solar panels on their rooftops, monitor how efficiently their EVs were charging, or experiment with home servers. They had no budget, and likely never would.
And that was perfectly fine.
Because some of those hobbyists also worked at large enterprises. Eventually, teams inside those companies would adopt Grafana more widely. And when they needed scale, support, or compliance-Grafana would already have a foot in the door.
“We’re set up to monetize people who have more money than time,”
- Raj Dutt, CEO of Grafana Labs
That simple philosophy shaped Grafana’s entire go-to-market strategy. Instead of pushing sales, they focused on creating value. The goal wasn’t to force monetization-it was to earn the right to monetize, when the timing made sense for the customer.
Grafana’s GTM motion didn’t begin with a sales pitch.
It began with adoption.
The Monetization Ladder: From Visualization to Full Observability Stack
Grafana didn’t launch with a business model. It built one gradually-as adoption matured and new needs emerged.
In the early years, there was no commercial offering. The company made money through support and professional services-helping teams who were already deep into Grafana and needed guidance with scaling or customizing it.
By the end of 2016, Grafana Labs was doing about $1M in annual revenue. All of it came from services.
The first real shift came with the launch of Grafana Enterprise. At this point, the team wasn’t trying to reinvent observability-they were simply monetizing the visualization layer that thousands of teams were already using. This was still founder-led sales. There was no GTM team. Just direct conversations with users who already knew the product inside out.
By the end of 2017, this brought their annual run rate to around $2M.
But to build a real business in observability, dashboards weren’t enough. Most of the pain-and most of the budget-was tied to storing and querying data at scale.
So, Grafana went broader. They built or integrated a full observability stack:
- Metrics (Grafana Mimir)
- Logs (Loki)
- Traces (Tempo)
This move-from single product to multi-product-was key. It turned Grafana into a serious alternative to full-stack observability vendors. By 2018, revenue had crossed $5M, and most of it was no longer from the visualization layer alone.
The final shift came with Grafana Cloud.
Instead of asking users to self-host everything, Grafana began prioritizing cloud delivery-shipping new features to the Cloud offering first, then open-sourcing later. This helped them accelerate innovation, deliver faster value, and simplify the buying process for larger teams.
By the end of 2018, Grafana Cloud had become their biggest revenue driver.
What’s notable is not just the growth-but the pace.
They didn’t monetize too early. They waited until they knew what users needed, and where they were already seeing value. And when they did monetize, they did it with clear value-adds-never by putting up walls around what was already free.
It wasn’t about capturing more. It was about capturing just enough-without compromising the community that got them there.
As Grafana’s product offerings matured, it became clear they needed a more structured way to engage the right customers at the right time.
GTM motion Built on “Heat” [a.k.a Developer Intent Signals]
Grafana didn’t hire its first sales team until it had already hit $1M in revenue. For the early years, growth came almost entirely from inbound interest-driven by developer adoption, community engagement, and helpful content.
But as the product evolved and enterprise demand grew, it became clear they needed a more structured approach.
In 2018–2019, Grafana brought in experienced GTM leaders:
- Graham Moreno (from MongoDB) as Director of Sales
- Doug Hanna as COO
- Dave Kranowitz as VP of Sales
At the time, Grafana was at $10M ARR with just six people across sales and marketing. Instead of scaling quickly, the team focused on building foundations:
- Segmented accounts by company size
- Created separate motions for large vs. small deals
- Built geographic teams for EMEA and APAC
- Expanded supporting functions like demand gen, product marketing, and events
But they didn’t follow a traditional sales playbook.
Instead of relying on cold outbound, Grafana focused on what they called “Heat”.
Doug Hanna, introduced the concept of “Heat” to describe the signals that suggest an account might be ready for a commercial conversation. Not based on clickstreams-but based on community and content engagement.
Think:
- Does the Account have the ability to pay? Does it fit the ICP requirements?
- Are they using Grafana Open Source already?
- Are they active in Grafana’s forums or Slack, attending webinars or community events?
- Are they contributing or asking detailed product questions?
- Are they engaging with documentation and tutorials?
- Are they contributing or asking detailed product questions?
None of these signals come from inside the product. But they’re powerful indicators of interest, intent, and value being derived.
This approach allowed Grafana to qualify accounts without ever compromising the developer experience. .
And when those signals reached a certain intensity-when multiple teams inside a company were involved, or someone from the security/compliance team started poking around-that’s when Grafana’s team would step in.
More heat = more willingness to talk.
Not because Grafana pushed-but because the value was already there.
And the outreach wasn’t a pitch, it was a discovery conversation
- How are you using Grafana today?
- What tools are you integrating with?
- Where are you running into scale or governance challenges?
Insights from these discovery calls weren’t just used to close individual deals. The sales team fed these learnings back into campaign design-refining messaging, content, and outreach for future accounts showing similar signals.
{{product-blog-banner}}
From Big Tent to Land and Expand: Grafana’s Sales Philosophy
Grafana’s sales approach stemmed from their Big Tent philosophy.
Instead of pushing companies to replace their existing stack, Grafana embraced the reality that most teams already had a mix of tools-Prometheus for metrics, Elastic for logs, Datadog for traces. Grafana’s role wasn’t to rip those out. It was to help bring them all together.
That’s the Big Tent idea: let teams keep what works.
Help them build one unified view-inside Grafana.
This mindset shaped everything about the sales motion.
Reps weren’t trained to talk down the competition.
They were encouraged to act like advisors-helping teams navigate complexity, not abandon their tools.
And because Grafana knew only a small fraction of users-maybe 1 to 3 percent-would ever convert, they focused on the right ones.
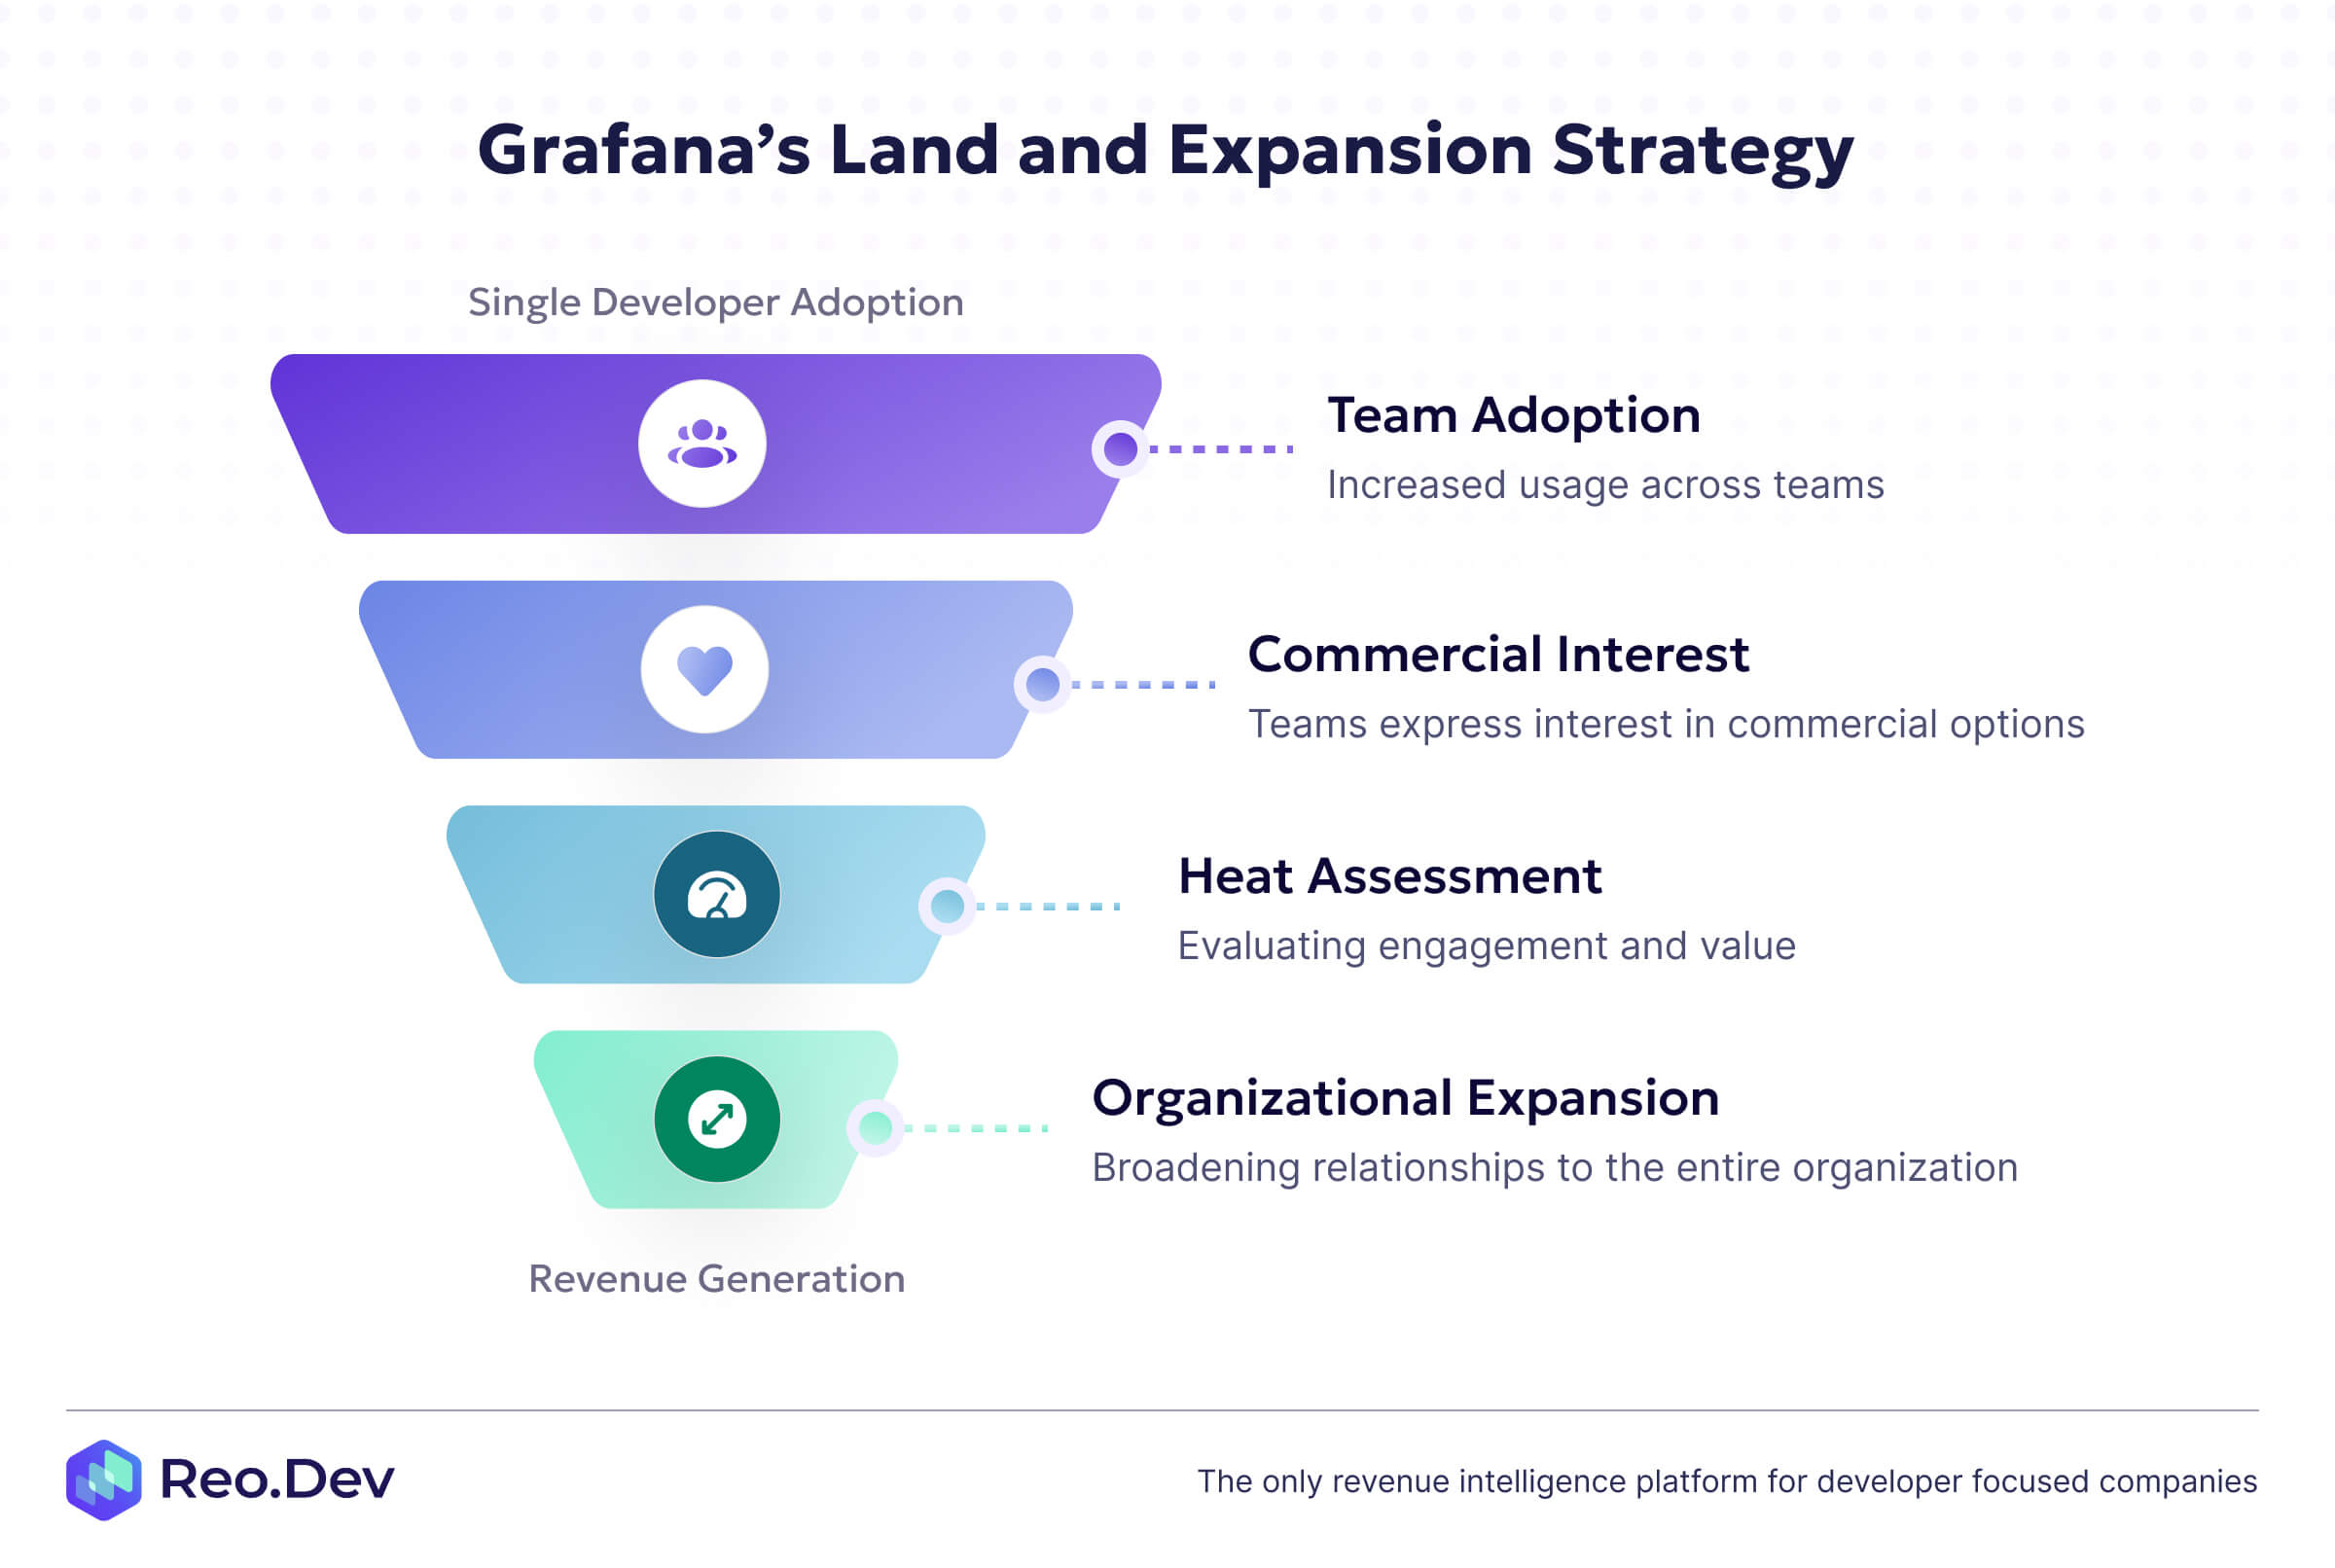
Most adoption started small. A single developer would use the open-source version to solve a local problem-building dashboards or plugging into Prometheus. No sales involved. No approvals needed.
As others on the team saw value, they’d start using it too. Before long, Grafana would be running on multiple dashboards across multiple teams-each solving their own problems independently.
At that point, things would start to break down:
- “How do we manage access across teams?”
- “Why are we duplicating dashboards across silos?”
- “Can we standardize this across the company?”
That’s where the Land and Expand motion kicked in.
Grafana rarely pushed for organization-wide deals upfront.
Instead, they let usage grow from the bottom up-then stepped in when it made sense. The sales team didn’t need to convince anyone of Grafana’s value. They just helped turn organic adoption into a formal relationship.
By the time security or engineering leadership got involved, Grafana was already embedded into daily workflows.
The question wasn’t should we use Grafana-it was how do we scale it safely and effectively?
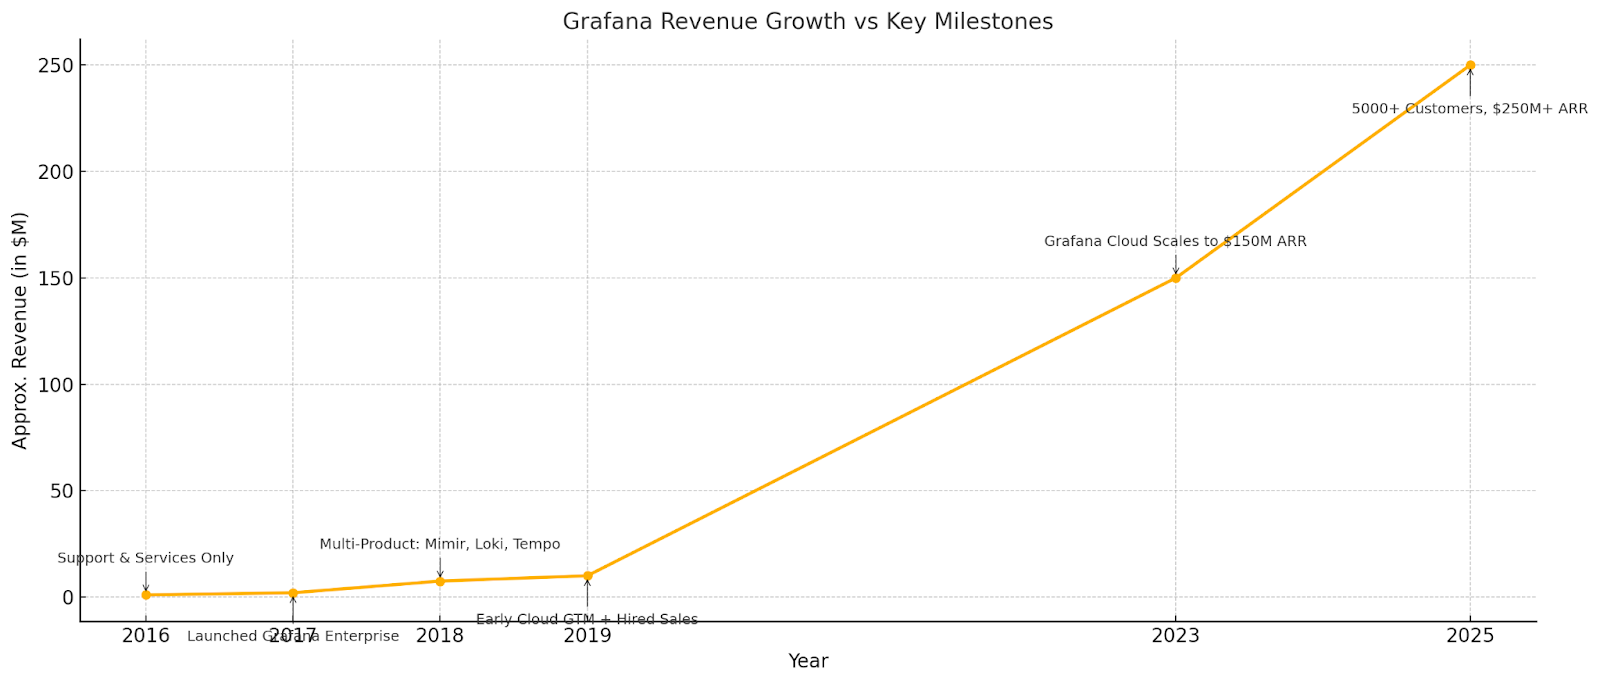
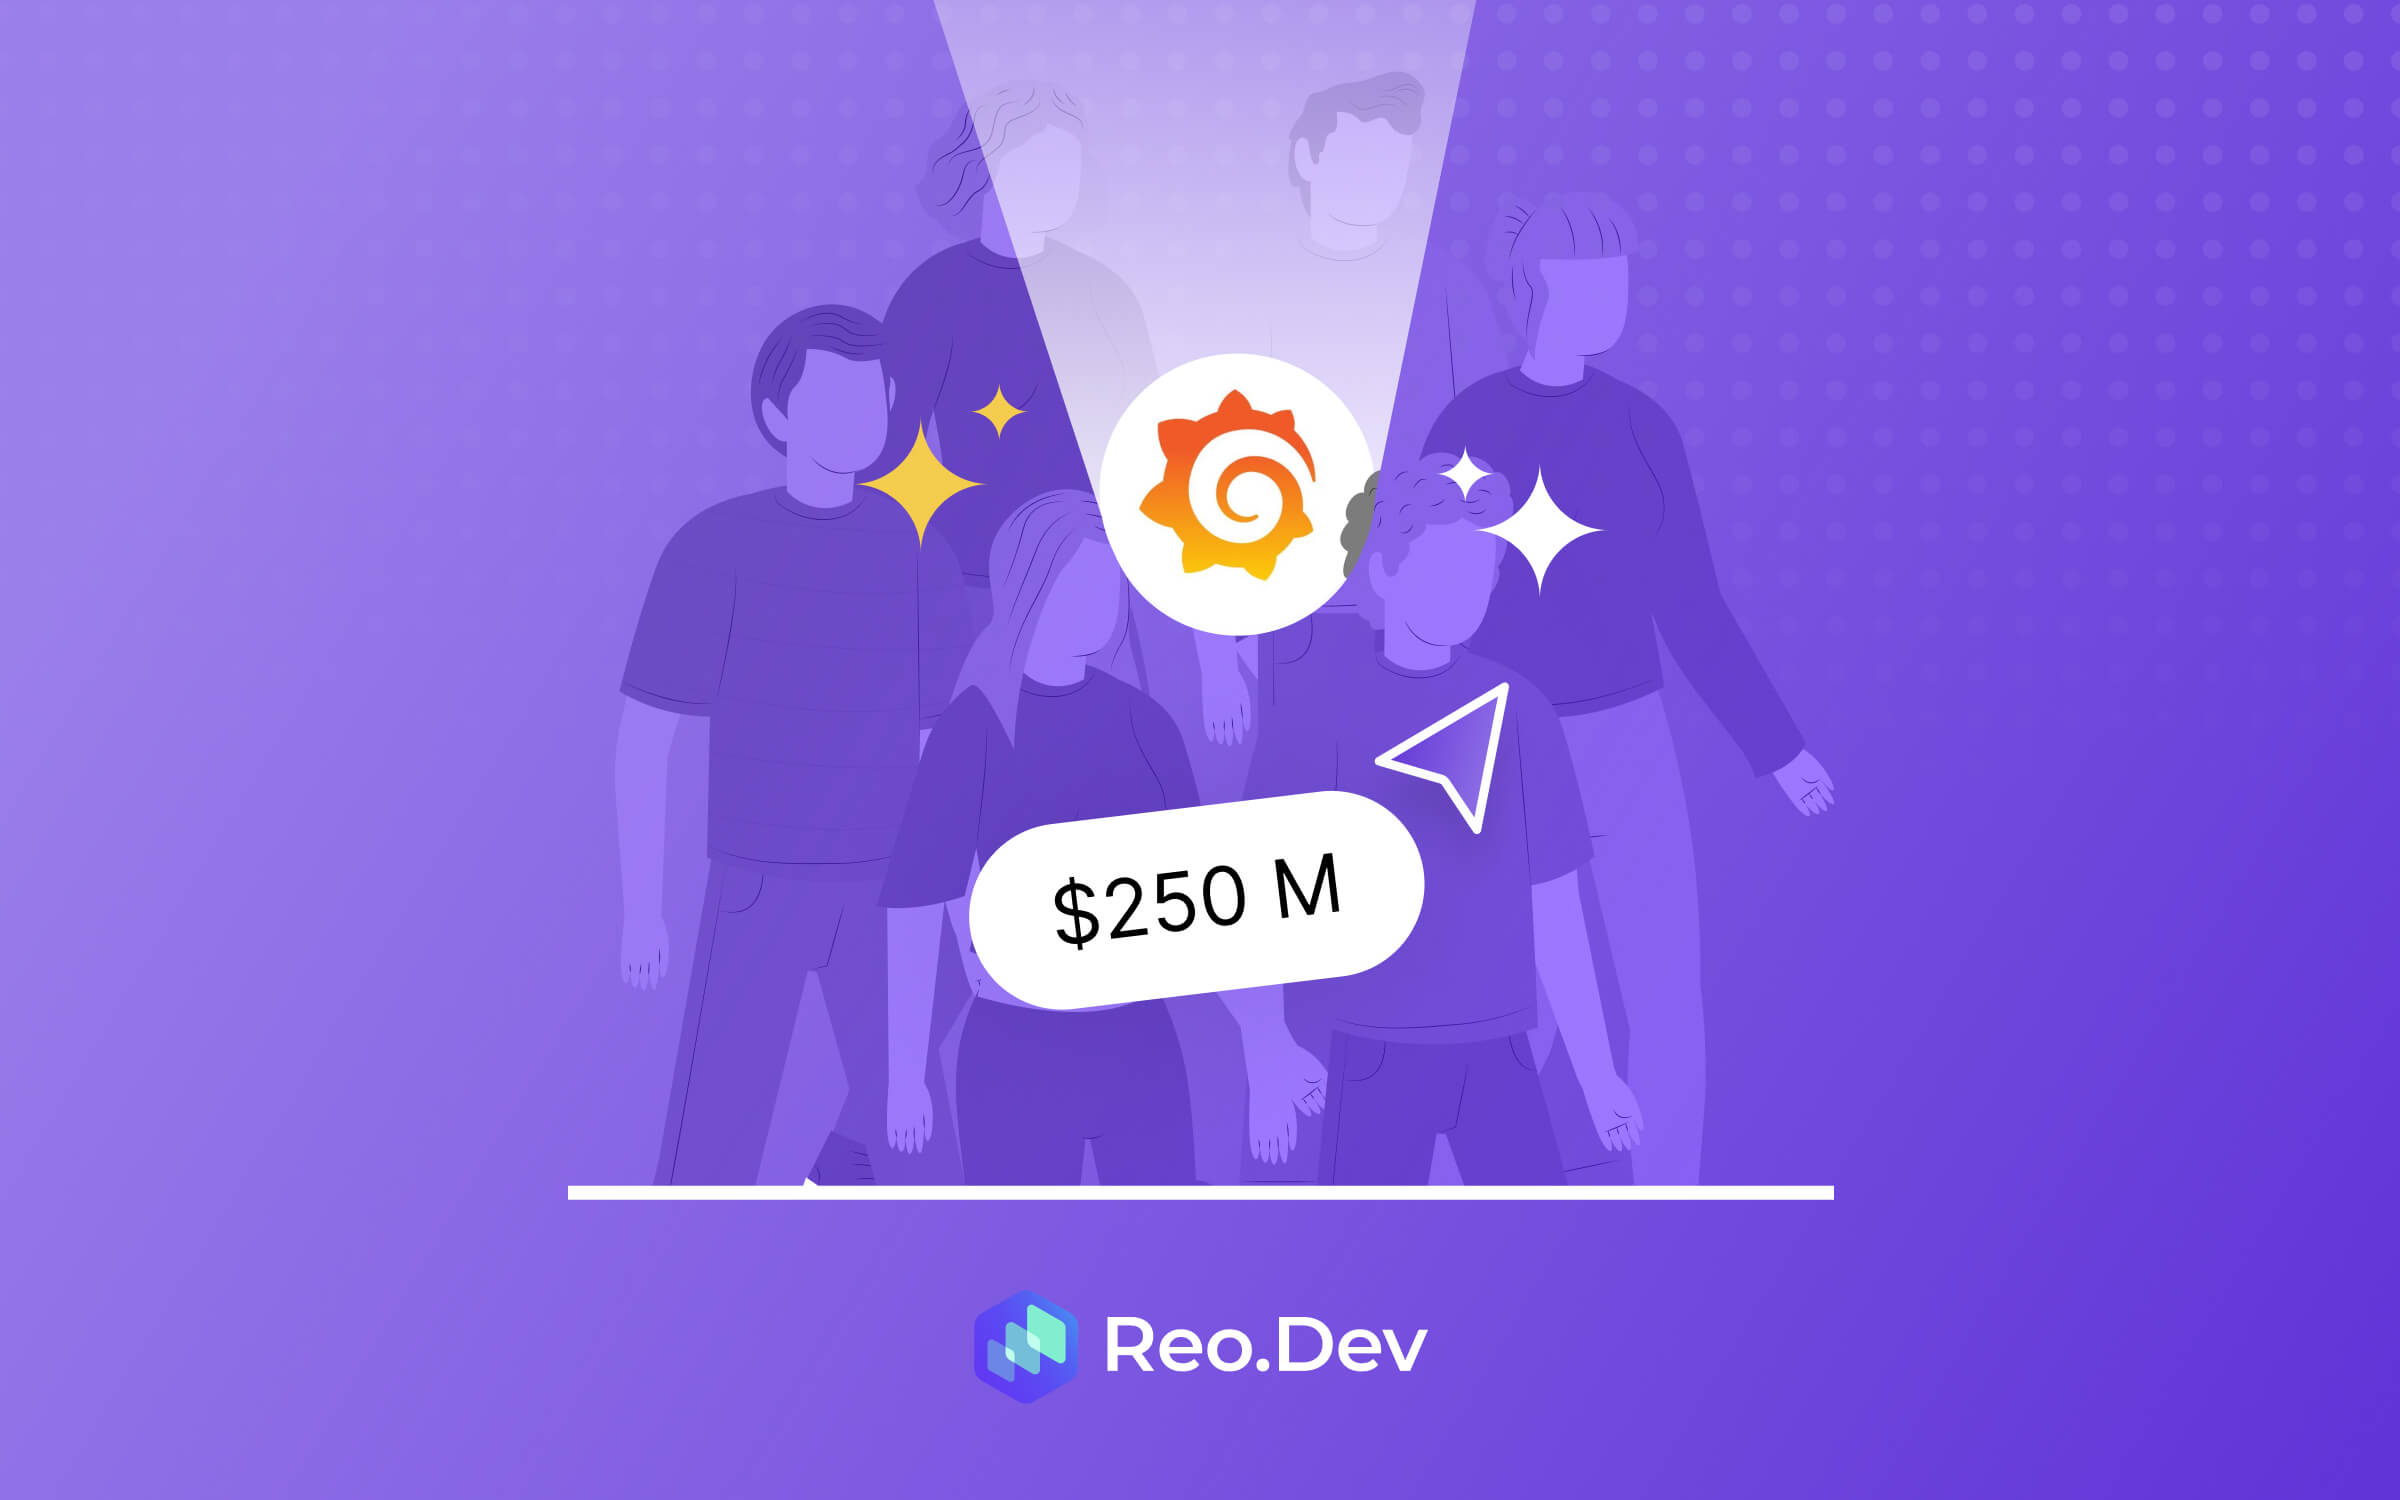
By 2023, Grafana had grown to $150M ARR. Today, it’s north of $250M, with over 5,000 paying customers.
And they got there not by fighting for control of the stack-but by quietly becoming the interface every team relied on.
By focusing on utility over lock-in, integration over replacement, and timing over pressure, Grafana turned a side project into the connective tissue of modern observability.
Their story is a masterclass in using a UI wedge to break into a crowded market-and scaling without ever breaking trust with the developer community that powered their rise.
Key Takeaways from Grafana
- Start with a single pain, solve it well
Grafana earned early developer love by solving one thing-intuitive, flexible dashboards. That deep focus gave them a wedge into engineering teams and workflows, creating a strong foundation to build upon.
- Play the long game - adoption comes before monetization.
Grafana spent over three years building a product developers genuinely loved - without pushing for revenue. Instead of rushing to sell, they focused on value, community, and trust. Only once usage scaled and enterprise needs became clear did they introduce paid offerings. That patience laid the foundation for sustainable, high-quality growth.
- Developer adoption ≠ Enterprise readiness
Grafana became wildly popular among developers early on—but popularity didn’t automatically translate to enterprise revenue. To bridge that gap, they took a staged approach:
- First, they monetized through services, supporting teams already deep into Grafana.
- Next, they launched Grafana Enterprise to address common asks from large orgs - like RBAC, audit logs, and scale support.
- Finally, they introduced Grafana Cloud to simplify delivery and accelerate value for enterprise buyers.
They didn’t try to retrofit enterprise features into a developer tool. They layered enterprise readiness on top of proven usage - at exactly the right time.
- Intent lead GTM
Grafana didn’t require users to sign up. Most of its free users were using Grafana open source. But that did not mean Grafana’s GTM teams were flying blind. Grafana tracked every intent signal: Who was engaging in the community? Who was reading their documentation? Who was attending webinars? Who was asking questions, opening issues on Github? And finally, who resembled their monetizable ICP profile? These signals help them focus on Accounts that were most likely to engage in a conversation and become paying customers.
- Technical Sales needs Advisors not pushy Sales rep
Grafana’s buyers weren’t new to the product. They were power users - engineering leaders, SREs, architects - already relying on Grafana internally. What they needed wasn’t a sales pitch. They needed someone who could help them scale, customize, and meet enterprise needs like security and compliance. Grafana’s sales team showed up as advisors, not sellers - and that made all the difference.
- Rip and Replace is hard! Playing along is easier
Grafana entered a space crowded with giants like Prometheus, Elastic, and Datadog. But instead of asking teams to switch, they played nicely with what was already there. Their “Big Tent” approach let teams unify existing tools under a single interface - making Grafana the glue, not the disruptor. That flexibility made it easier to earn trust and expand adoption across the org.
Are you driving Go-To-Market at a DevTool company?
If yes, this next part is for you.
Reo.Dev is the leading intent signal platform purpose-built for DevTool GTM teams.
100+ companies—from open-source startups to enterprise-focused platforms—use Reo.Dev to:
- Identify in-market engineering teams
- Track developer behavior across GitHub, docs, Slack, and more
Prioritize accounts showing real buying intent - Trigger smart, contextual outreach—right when it matters
“Reo.Dev helped us increase meetings booked by 20%. Since a month after onboarding Reo.Dev, 40% of our total deal pipeline has come from accounts identified by Reo’s intent signals.”
— Orlando Nieves, RevOps Lead, Unstructured
“In the first week of full deployment, Reo.Dev generated 3 meetings. With actionable insights, we can identify and engage prospects at the precise moment they show interest”
— Mahesh Babu, Head of Marketing, Kodem
“We booked 2X more meetings and generated 70% higher ROI on ad campaigns using Reo.Dev”
— Shai Alani, VP Marketing, Aporia
“We have seen a 30% increase in product sign-ups, month over month, since we started using Reo.Dev. Their data is one of the best data that I have seen in my line of work”
— Kevin Doubleday, Communications Director, Fluree


Want to see which dev teams are actually evaluating you?
👉 Get a live walkthrough of Reo.Dev and learn how to turn intent into pipeline.